Most sponsorship packages are priced like this: someone finds an old PDF from another event, swaps the logo, and hopes $5,000 sounds right for Gold. Nobody can say what the sponsor is actually getting, or whether the tier even covers what it costs to deliver.
Sponsorship Builder makes the guesswork visible. It values each deliverable the way a media buyer would, by how many people see it and what that audience costs on a comparable paid channel, then adds up tiers, suggests a price, works out your margin and checks that the tiers make sense as a ladder. Every number has a “show the math” line, so you can defend a price in a meeting or change the assumption you disagree with.
I built it alongside FirstShow, my sponsorship company. It’s for event organizers, festival and conference teams, and anyone writing their first sponsor deck.
How it works
Impressions per deliverable
Each deliverable is valued by a channel. Five channels are based on reach, one is a fixed dollar value:
signage     attendance × days × sign views per attendee per day   (per placement)
stage       attendance × % in the room                            (per mention)
social      followers × reach %                                   (per post)
newsletter  list size × open rate                                 (per send)
website     monthly visits                                        (per month listed)
fixed       a dollar value you set                                (tickets, booth, speaking slot)
Then the standard media formula:
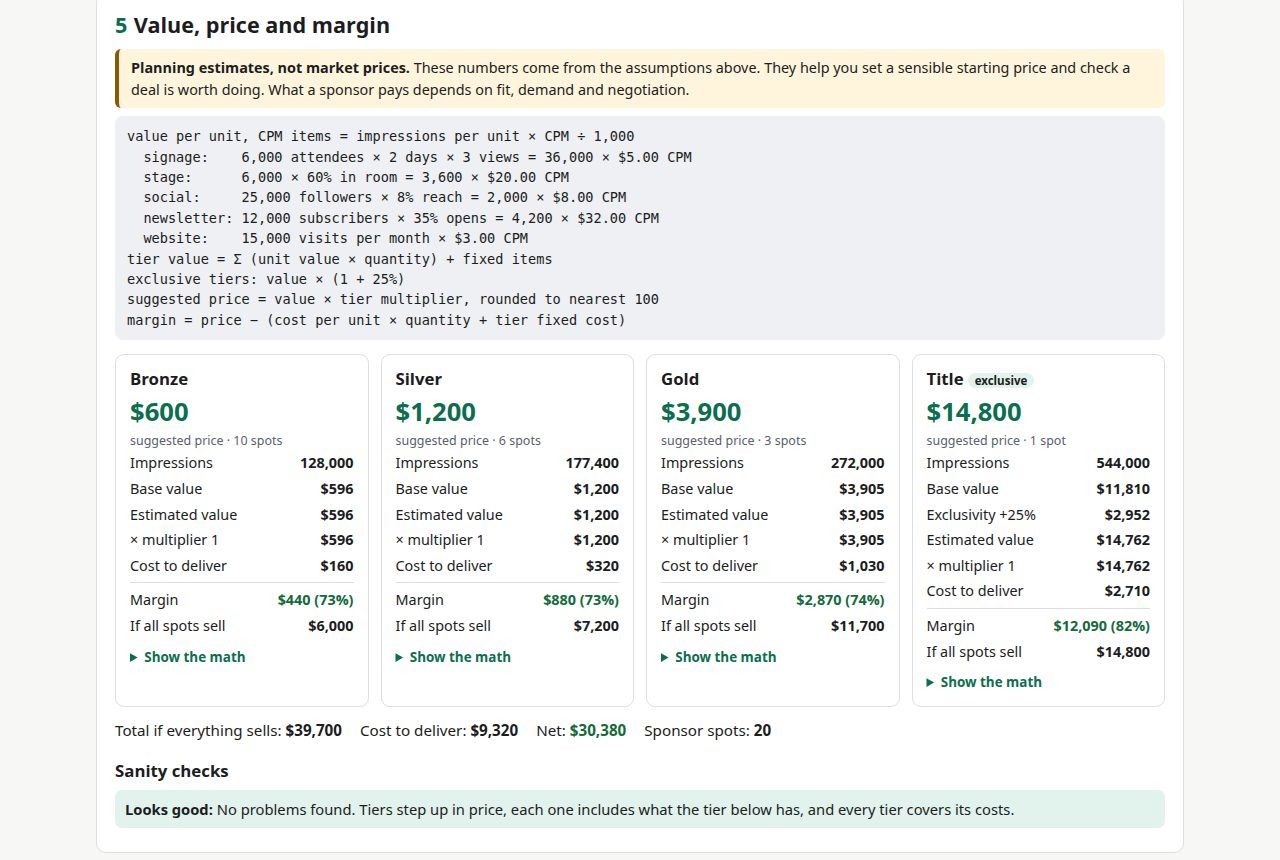
value per unit = impressions per unit × CPM ÷ 1,000
Default CPMs, and where they come from
| Channel | Default CPM | Borrowed from |
|---|---|---|
| On-site signage | $5 | Out-of-home billboards, roughly $3 to $8 |
| Stage / MC mention | $20 | Host-read podcast ads, roughly $18 to $26 |
| Social post | $8 | Meta (Facebook + Instagram) average |
| Newsletter feature | $32 | Cross-industry median newsletter sponsorship |
| Website logo | $3 | Google Display Network average, about $2.80 |
Event signage and a live stage mention don’t have their own published CPMs, so I used the closest paid channel: a billboard for a sign, a host-read audio ad for an MC reading your name. The defaults for sign views (3 a day), share of attendees in the room (60%), social reach (8%) and newsletter open rate (35%) are placeholders. The page tells you to replace them with your own analytics.
From deliverables to a price
tier value       = Σ (unit value × quantity) + Σ (fixed value × quantity)
exclusive tier   = value × (1 + exclusivity premium)        default 25%
suggested price  = value × tier multiplier, rounded         to 1, 50, 100, 250 or 500
cost to deliver  = Σ (unit cost × quantity) + tier fixed cost
margin           = price − cost to deliver
The multiplier is the lever between “what the exposure is worth” and “what this audience is worth to this sponsor”. A senior B2B audience justifies more than CPM math alone suggests, so the conference example uses 1.5× and much higher CPMs ($90 for its newsletter).
Worked example
The festival example is a two-day event with 6,000 attendees a day, a 12,000-person email list, 25,000 social followers, 15,000 monthly site visits and $65 tickets. With the default assumptions:
- One sign placement:
6,000 × 2 days × 3 views = 36,000 impressions × $5 ÷ 1,000 = $180 - One newsletter feature:
12,000 × 35% = 4,200 opens × $32 ÷ 1,000 = $134.40 - One stage mention:
6,000 × 60% = 3,600 × $20 ÷ 1,000 = $72 - One social post:
25,000 × 8% = 2,000 × $8 ÷ 1,000 = $16 - One month on the website:
15,000 × $3 ÷ 1,000 = $45
Bronze gets one sign, six months on the website, one social post and two tickets: $180 + $270 + $16 + $130 = $596, rounded to $600. It costs $160 to deliver (sign production plus 30% of ticket value), so the margin is 73%.
| Tier | Spots | Estimated value | Suggested price | Margin |
|---|---|---|---|---|
| Bronze | 10 | $596 | $600 | 73% |
| Silver | 6 | $1,200 | $1,200 | 73% |
| Gold | 3 | $3,905 | $3,900 | 74% |
| Title (exclusive) | 1 | $14,762 | $14,800 | 82% |
Title’s base value is $11,810. The 25% category exclusivity premium adds $2,952, and naming rights alone account for $3,000. If every spot sells, the package brings in $39,700.
One honest observation from that table: the social post is the cheapest thing on it. At 8% organic reach, 25,000 followers is 2,000 impressions, worth $16. That’s often the deliverable organizers lead with, and the math says it’s a garnish.
Sanity checks
The tool reads the tiers as a ladder, lowest to highest, and flags:
- A tier priced at or below the one under it (a fix).
- A step under 1.3× the tier below (“most sponsors stay at the cheaper tier”, aim for 1.5× to 3×) or over 4× (a hole in the middle).
- A higher tier with more spots than a lower one.
- A higher tier getting less of any deliverable than the tier below. Upgrading should never mean losing something.
- Negative margin (a fix) or margin under 30% (leave room for negotiation).
- An exclusive tier with more than one spot, and an exclusive deliverable that could be sold more than once across tiers and spots.
The festival example passes all of them: the steps are 2×, 3.25× and 3.8×. Adding a tier copies the previous tier’s deliverables, so new tiers start out passing the “never lose something” check.
The sponsor sheet
The output is a one-page, letter-size sponsor sheet: event name, date and location, audience description, headline stats (attendees, days, subscribers, followers, monthly visits), then tiers from highest to lowest with price, spots, an exclusivity note and the deliverables list. Print CSS hides everything else, so print, then save as PDF. Estimated values are off by default; if you show them, the footer adds that they are planning estimates, not guaranteed results. The same package exports as markdown, plain text or a CSV with every line item.
Design decisions
- A formula you can read. The full formula is printed on the page with your numbers substituted in, and each tier card has its own breakdown. A price you can’t explain is a price you can’t defend.
- Value is not price. The tool keeps estimated value, suggested price, cost and margin as separate numbers, because a sponsor deck that conflates them falls apart under questions.
- Everything stays in the browser. No accounts, analytics or cookies. Work autosaves to localStorage, with named versions, JSON import and export, and a share link that carries the package in the URL hash. The hash isn’t sent to the server, though anyone with the link can read it.
Limits
- These are planning estimates, not what the market will pay. CPM is a proxy for exposure; it doesn’t capture lead generation, hospitality, or the value of being associated with a cause.
- Most CPM benchmarks are US-dollar figures, applied as-is in whatever currency you choose.
- Signage and stage CPMs are borrowed from adjacent channels, not measured for live events.
- Social reach counts the organizer’s followers only. Attendees posting from the event isn’t modelled.
- Fixed values (booth, speaking slot, naming rights) are whatever you type. The tool can check them for consistency, not for accuracy.
Load the festival example and change one assumption to see how far the prices move.